SVTbx: Security Valuation Toolbox
Last update: Dec 2018
"Beware of geeks bearing formulas." [Warren Buffet]
In 2015, I developed a Security Valuation Toolbox. People value businesses, computer software does not. Using computers can and does help with reporting, automatizing routine procedures, and some analysis, though. They won't read a 10-K report for you but can do other useful stuff.
The toolbox uses detail accounting and other fundamental data to analyze publicly traded companies and helps in an assessment of the range of their "intrinsic value." Advanced screening and "intelligent" watch lists are an important part of the toolbox. The purpose of the SVTbx is informational only and does not offer a substitute for a thorough analysis of a business, its financials, and competitive position. It does, however, offer an opportunity to gain an important piece of analytical insight into the market valuation. It also saves huge amount of time that would be spent on important but routine activities...
The valuation techniques used are based on my analysis, relying mostly on accounting valuation methods, asset pricing theories, with some help of computational statistics, and machine learning. An important component of the toolbox is a suite of valuation models, relying on forms of multi-stage valuation models. Companies can be screened on many criteria, including the assessed "price-to-value" (P/V).
A branch of the toolbox is being devoted to macro-based asset pricing, for aggregate indices, based on the macro-economic variables, aggregated individual accounting data, using state-of-the-art macroeconomic models used in central banks, IMF or ECB.
This is mainly a research project testing new approaches to top-down and bottom-up monitoring and surveillance of financial markets, potentially useful for "early warning exercises."
COVERAGE:
The core of the SVT analysis uses publicly available data for businesses traded on selected markets, namely the U.S. market (NYSE, NASDAQ, AMEX and Pink Sheets for some applications), Vienna Bourse, Frankfurt XETRA and Frankfurt Stock Exchange, Paris and Brussels Euronext, Australia's ASX, Toronto Stock Exchange, London's LSE, Stockholm and Oslo stock exchanges. The space covers roughly 10K+ companies, excluding Pink Sheets. I use data for key financial and accounting indicators (balance sheet, income statement, and cash-flow statement data) and information about prices, volume traded, ownership, industry, etc.
PLATFORM:
The toolbox is implemented using Matlab-Java-MySQL-LaTeX-JavaScript/HTML environment for the most part, using a codebase that is easy to port to other systems. Reporting is based on HTML/JavaScript and pdfLaTeX/TikZ (PDFs). The software is for personal use and all the examples are only illustrative. Please, note that none of these reports constitute an investment advice.
Examples of Use:
Notes & Research Papers
"Beware of geeks bearing formulas." [Warren Buffet]
In 2015, I developed a Security Valuation Toolbox. People value businesses, computer software does not. Using computers can and does help with reporting, automatizing routine procedures, and some analysis, though. They won't read a 10-K report for you but can do other useful stuff.
The toolbox uses detail accounting and other fundamental data to analyze publicly traded companies and helps in an assessment of the range of their "intrinsic value." Advanced screening and "intelligent" watch lists are an important part of the toolbox. The purpose of the SVTbx is informational only and does not offer a substitute for a thorough analysis of a business, its financials, and competitive position. It does, however, offer an opportunity to gain an important piece of analytical insight into the market valuation. It also saves huge amount of time that would be spent on important but routine activities...
The valuation techniques used are based on my analysis, relying mostly on accounting valuation methods, asset pricing theories, with some help of computational statistics, and machine learning. An important component of the toolbox is a suite of valuation models, relying on forms of multi-stage valuation models. Companies can be screened on many criteria, including the assessed "price-to-value" (P/V).
A branch of the toolbox is being devoted to macro-based asset pricing, for aggregate indices, based on the macro-economic variables, aggregated individual accounting data, using state-of-the-art macroeconomic models used in central banks, IMF or ECB.
This is mainly a research project testing new approaches to top-down and bottom-up monitoring and surveillance of financial markets, potentially useful for "early warning exercises."
COVERAGE:
The core of the SVT analysis uses publicly available data for businesses traded on selected markets, namely the U.S. market (NYSE, NASDAQ, AMEX and Pink Sheets for some applications), Vienna Bourse, Frankfurt XETRA and Frankfurt Stock Exchange, Paris and Brussels Euronext, Australia's ASX, Toronto Stock Exchange, London's LSE, Stockholm and Oslo stock exchanges. The space covers roughly 10K+ companies, excluding Pink Sheets. I use data for key financial and accounting indicators (balance sheet, income statement, and cash-flow statement data) and information about prices, volume traded, ownership, industry, etc.
PLATFORM:
The toolbox is implemented using Matlab-Java-MySQL-LaTeX-JavaScript/HTML environment for the most part, using a codebase that is easy to port to other systems. Reporting is based on HTML/JavaScript and pdfLaTeX/TikZ (PDFs). The software is for personal use and all the examples are only illustrative. Please, note that none of these reports constitute an investment advice.
Examples of Use:
- Elementary valuation screen example (printout w/o interactive features; see figure below for an older version)
- "Moat Watch" Screen Example [pdf] -- a printout of a JavaScript-powered report w/o interactive features
- Examples of recursive valuation (BHP, RL, ALL) using three valuation scenarios...
- Basic analytical report for a company and 'intrinsic value' computation
- Sector analysis and peer comparison
- Relative position screening (screen based on reporting firms which for N parameters are better than median of its peers)
- ...
Notes & Research Papers
- RIM1 Valuation Model -- structure, assumptions, uncertainty assessment
- NE1 Normalized-Earnings Computation
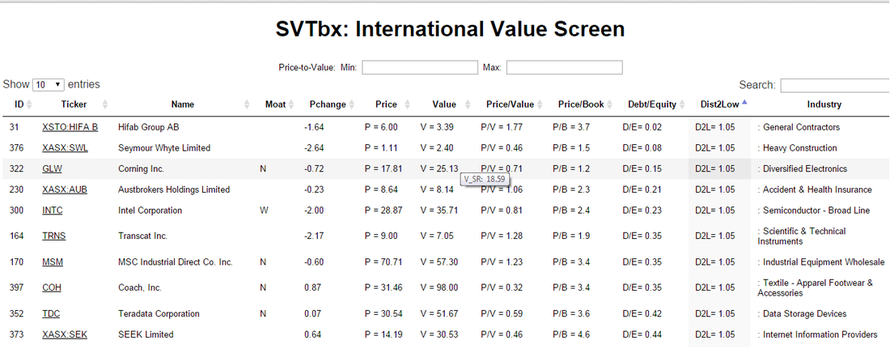
Example of a valuation screen. D/E = Long-Run Debt to Equity, Dist2Low = P/52weekLow, Value = result from the SVTbx valuation, with the value in the "pop up" bubble (V_SR) being a more conservative valuation for the particular company.
Tracing Market Dynamics: Histogram of Price-to-Value Ratio of Pre-Screened Companies
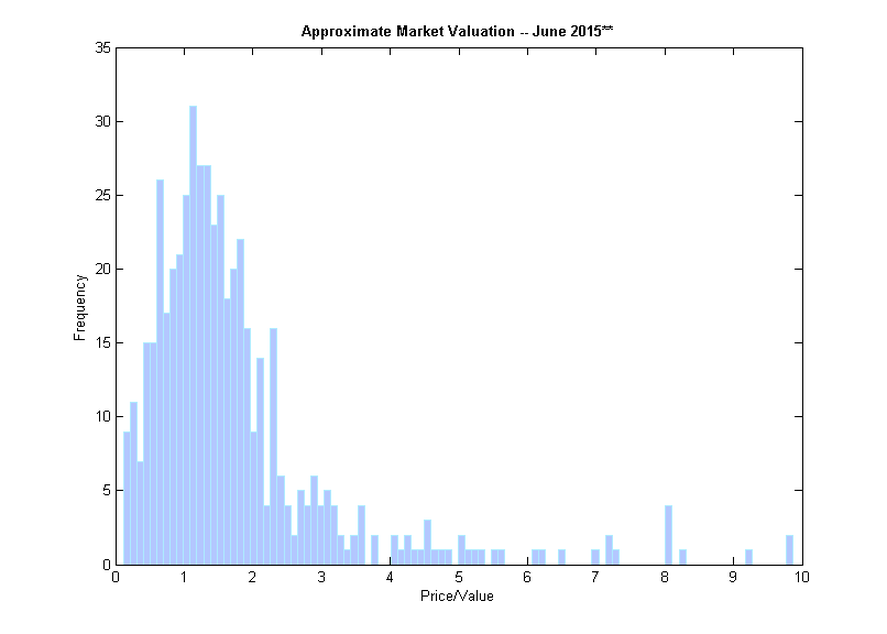
**) Histogram of approximate price/value ratio for companies with long-term debt share of equity smaller than 0.45, history of positive free cash flow, and book value CAGR (after adding back dividends) at least 7%. N = 504. Markets: Nyse, Nasdaq, Deutsche Borse/Xetra, ASX, TSX, Euronext Paris, Stockholm, Oslo.
Pseudo Real-Time Valuation Benchmarking Example: Woolworth Ltd., Australia
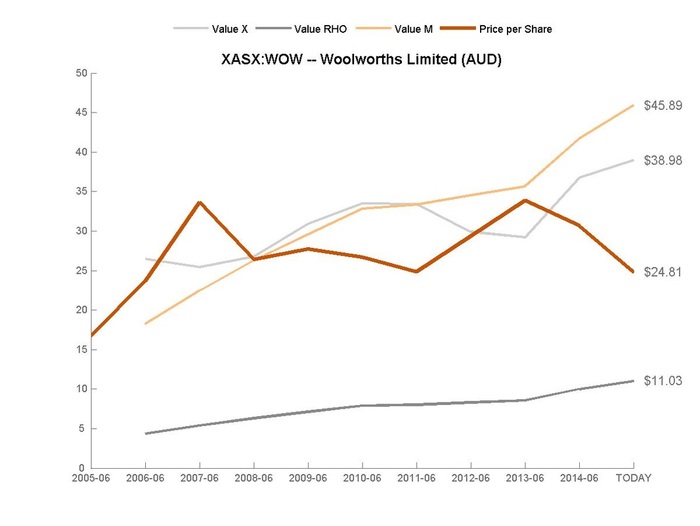
The three valuations are relevant for both their level and their dynamics. The dynamics provides the information about the suitability of the model setup for the corporation considered. This is a way to find out if the valuation is too optimistic on average, for instance. The level of three valuations depends on different assumptions and thus provides some information of valuation uncertainty. "X" valuation is rather extrapolative of about current situation, "M" value is more conservative and makes assumptions about different stages of firm and industry maturity, while "RHO" valuation is a rather defensive valuation, an envelope, of a situation where the firm looses quickly its competitive advantage...
DISCLAIMER:
The views expressed herein are those of the author and should not be attributed to the International Monetary Fund, its Executive Board, or its management. The toolbox is for private use and research purposes only, based on publicly available information.
The views expressed herein are those of the author and should not be attributed to the International Monetary Fund, its Executive Board, or its management. The toolbox is for private use and research purposes only, based on publicly available information.
