HVM :: Assessing House Prices -- Borrowing-Capacity and Investment Approach
The goal of Housing Valuation Monitor is to monitor median house prices and provide a simple and transparent assessment of warranted value of median housing given the state of the economy and its outlook.
This is a joint project with Miroslav Plasil from the Czech National Bank.
The Toolbox developed we use two approaches to assess house prices in countries, counties, or cities available. First, we consider the household borrowing capacity and how much housing can households afford given their income, market interest rates, and their down-payment. Second, we provide a forward-looking valuation of the property based on the owner-occupier's problem of valuating the property. Here the value is given by the present value of net rental income.
Our borrowing-capacity approach to house prices assessment is both simple and powerful. Let's assume that households can allocate, at origination, a portion \(\alpha\) of their income, \(Y_{t}\), to service their mortgage. At prevailing market mortgage rate, \(i_{t}\), there is a simple, non-linear formula to uniquely determine the mortgage loan available for \(N\) years. Attainable housing value is then a combination of the mortgage loan, \(L_{t}\), and the down payment, \(D_{t}\), i.e. \(PH_{t} = L_{t} + D_{t}.\) Assuming a stable loan-to-value (LTV) limit, the attainable housing is given by
\[ PH_{t} = \frac{1}{LTV}\left[\frac{(1+i_{t})^N-1}{i_{t} (1+i_{t})^N}\right] \times \alpha Y_{t}.\]
Given this straightforward formula, it is easy to trace the contribution of household income and mortgage interest rates to growth of house prices, see below.
Publicly-Available Country Coverage:
Methodology and Applications:
- United States, Czech Republic, Canada (11 metropolitan areas)
Methodology and Applications:
- Assessing House Prices: Simple Valuation and Prudential Measures [draft] and slides [pdf] (July 2018), joint with M. Plasil. Two methods of assessment are used: (i) borrowing-capacity approach and (ii) investment approach, based on the NPV of net-rental income
- Assessing House Prices in Canada [pdf] IMF's Selected Issues Paper assessing house prices in Canada and its 11 Census Metropolitan Areas (CMAs) using the borrowing-capacity approach for the IMF's Article-IV surveillance mission.
- The Value of Housing in the U.S.: A Forecast Survey Perspective: [pdf] -- this paper describes housing valuation in terms of the present value of expected rental income of property owners based on Bluechip survey forecasts of disposable income of households and interest rates.
- Quarterly Housing Valuation Model (QHVM): [pdf] -- a trend-cycle state-space model for housing valuation. Valuation is based on the present-value approach and on the households' borrowing-capacity approach.
House Prices vs. Attainable House Prices in Canada-- 2000Q1--2019:Q1
Source: IMF (2019)
House Prices in Prague, the Czech Republic -- Real-Time Recursive Valuation Using the Toolbox
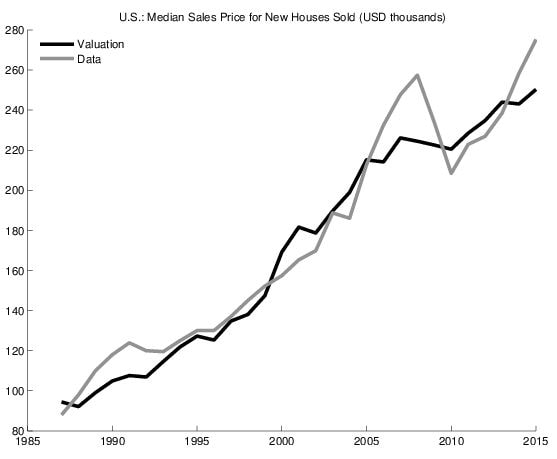
U.S.: Median Sales Price for New Houses Sold vs. the Present Value of Rental Revenue
Decomposition of "Attainable Prices" in Edmonton, Alberta, into contribution of income growth and change in mortgage rates
Given the simple pricing formula above, see IMF (2019), it is easy and instructive to decompose the fundamental house prices into contribution of income growth and change in the mortgage rates. As it is discussed in IMF (2019), house prices in Edmonton exceeded the estimated attainable levels in 2007-2012. The convergence of the market price with the estimated attainable price was brought about due to the robust income growth (light blue) and exceptionally large decline in mortgage rates, pushing house prices growth.
Source: IMF (2019)
DISCLAIMER:
The views expressed herein are those of the author and should not be attributed to the International Monetary Fund, its Executive Board, or its management. The toolbox is for private use and research purposes only, based on publicly available information.
